Tier Restructuring Experiments and Their Effect on Mid-Market Conversion
Data shows how restructuring pricing tiers unlocks mid-market conversions.

Mid-market buyers sit in the worst possible spot on the pricing map: enough budget to move up a tier, enough stakeholders in the room to stall the decision. Tier restructuring, collapsing tiers, adding them, or just repositioning what's inside them, changes conversion in that zone in ways that are measurable and often backwards from what a pricing team expects. This piece lays out what the data says about those experiments, and how to run one without guessing.
Seat-based and flat-tier pricing came from a simpler era of procurement, back when software was something you assigned to a person rather than something a person and a handful of AI agents used together. That model is now visibly out of step with how buyers evaluate usage-heavy and next-generation tools. Zylo's 2026 SaaS Management Index put average app count at 305 per organization, with spend up nearly 8%, and vendors are responding by restructuring tiers to pull more revenue out of accounts they already have, not just to win new ones. Tropic's H1 2025 data found mid-market spend per employee rose 7%. Buyers are already paying more. Converting willingly is not the same thing, and how those two things differ is the entire subject of this article.
The stall is primarily about cognitive load, not price sensitivity. It's cognitive load: too many tiers to compare, features that don't clearly separate one plan from the next, or a price jump that skips right over the budget bracket procurement already signed off on. Tier restructuring, done with any rigor, is a conversion intervention with outcomes you can measure in a dashboard. Treated as a coat of paint on the pricing page, it wastes the one lever most companies aren't using enough.
The pricing model landscape that makes tier restructuring urgent right now
Tiered pricing still dominates. Profitwell's SaaS pricing benchmark, cited via Zylo's research, puts 67% of SaaS companies on a tiered model as their primary structure. But that number hides how much is changing inside those tiers. Thirty-eight percent of SaaS companies now build usage elements into their pricing, a share that used to be a rounding error and now describes more than a third of the market. Tiers aren't clean feature gates anymore. They're hybrids, part seat count, part usage meter, part feature list, and buyers are asked to evaluate all three at once.
Gartner projects that 70% of businesses will prefer usage-based pricing over per-seat models by 2026, and that 40% of enterprise SaaS contracts will carry some outcome-based component. Layer that on top of a pricing environment where SaaS prices rose 11.4% in 2025 compared to 2024, roughly four times the G7 inflation rate over that period according to Momentum Nexus, and the picture gets clearer: tier restructuring is doing double duty right now. It's a simplification exercise, and it's also the vehicle a lot of vendors are using to push price increases through without calling them that.
That double duty creates a specific mid-market problem. One vendor's data puts usage-uplifts on renewal at 20 to 37%. A buyer hits a restructured tier and has no reliable way to tell whether the new price reflects real added value or is just the old plan with a markup and a new name. Research cited via Momentum Nexus found that bad pricing structure can depress revenue by 30 to 50% compared to an optimized structure, even when the sticker price is at market rate, the cost of shipping a tier structure nobody tested. That's not a rounding error either. It's the cost of shipping a tier structure nobody tested.
What tier restructuring means: collapsing, expanding, and repositioning
Three moves fall under this heading, and each behaves differently once it hits a real buyer.
Collapsing means cutting the number of tiers, five down to three, say. It removes choices, and with them, some of the paralysis that comes from comparing five nearly-identical plans. Expanding means adding a tier, three up to four, to fill a gap between two existing brackets, catching buyers who were over-served by the entry plan or under-served by the middle one. Repositioning leaves the tier count alone and changes what's inside: the feature boundary, the name, or where the price actually jumps. It's the most common move and, oddly, the one buyers notice least while it's happening to them.
Each has its own way of failing. Collapse too aggressively and the middle buyer has nowhere to land. Expand without a clear rationale and the new tier eats the anchor plan instead of adding revenue next to it. Reposition without a migration plan and existing customers get confused or angry about a change they didn't ask for.
Naming counts as repositioning too, and it's shifting. Plan names shape how a buyer self-selects before reading a single feature line, and the language choices vendors make here are part of the repositioning decision. That matters because naming is how a buyer self-selects into a tier before reading a single feature line. On the price ladder itself, how the jumps between tiers are spaced shapes which option buyers gravitate toward, and deviating from a spacing that feels proportional is itself a restructuring decision, whether or not anyone on the pricing team meant to make one.
None of these three moves happens in isolation in practice. The more instructive experiments combine them, adding a tier while also moving the feature line between two existing ones, for instance, because the market rarely hands you a problem that only needs one kind of fix.
Experiments that collapsed tiers: what the conversion data shows
One SaaS team cut its tier count from five down to three, cleaned up the feature list on each plan, and added a "Most Popular" badge to the middle option. Conversion moved from 1.2% to 3.1%, a 158% lift, without a single price changing (Digital Applied, 2026). The mechanism is straightforward once you see it: fewer tiers forced cleaner feature groupings, and cleaner groupings resolved the confusion that had been stalling mid-market buyers on the pricing page.
The badge did real work here, not decorative work. Fewer tiers means fewer cues for a buyer trying to figure out where they belong, and the badge functions as the anchor that replaces those missing cues.
Collapsing doesn't always help. If removing the middle tier means an entry-level buyer would need to triple their spend just to reach the features they actually need, collapsing doesn't convert that buyer up. It pushes them out, and churn on the entry plan rises instead. Columbia University research found that too many options can reduce purchase likelihood by up to 40%, which is the empirical case for why collapsing works when the prior structure really was overbuilt. But it also means collapsing only works when overbuilding was the actual disease. Enterprise procurement in particular often needs a mid-tier that matches a budget bracket someone already got approved internally; collapse past that bracket with nothing to replace it, and the buyer loses the compliance handle they needed to say yes.
The testing implication changes which drop-off point the team must track, shifting attention from the top-line conversion rate to where drop-off moves next. A collapsing experiment needs to track where drop-off moves, not just whether the top-line conversion rate improved. If drop-off shifts from the pricing page into the sales conversation, the tier structure solved one problem and created a different one downstream.
Experiments that added tiers: when expansion converts and when it cannibalizes
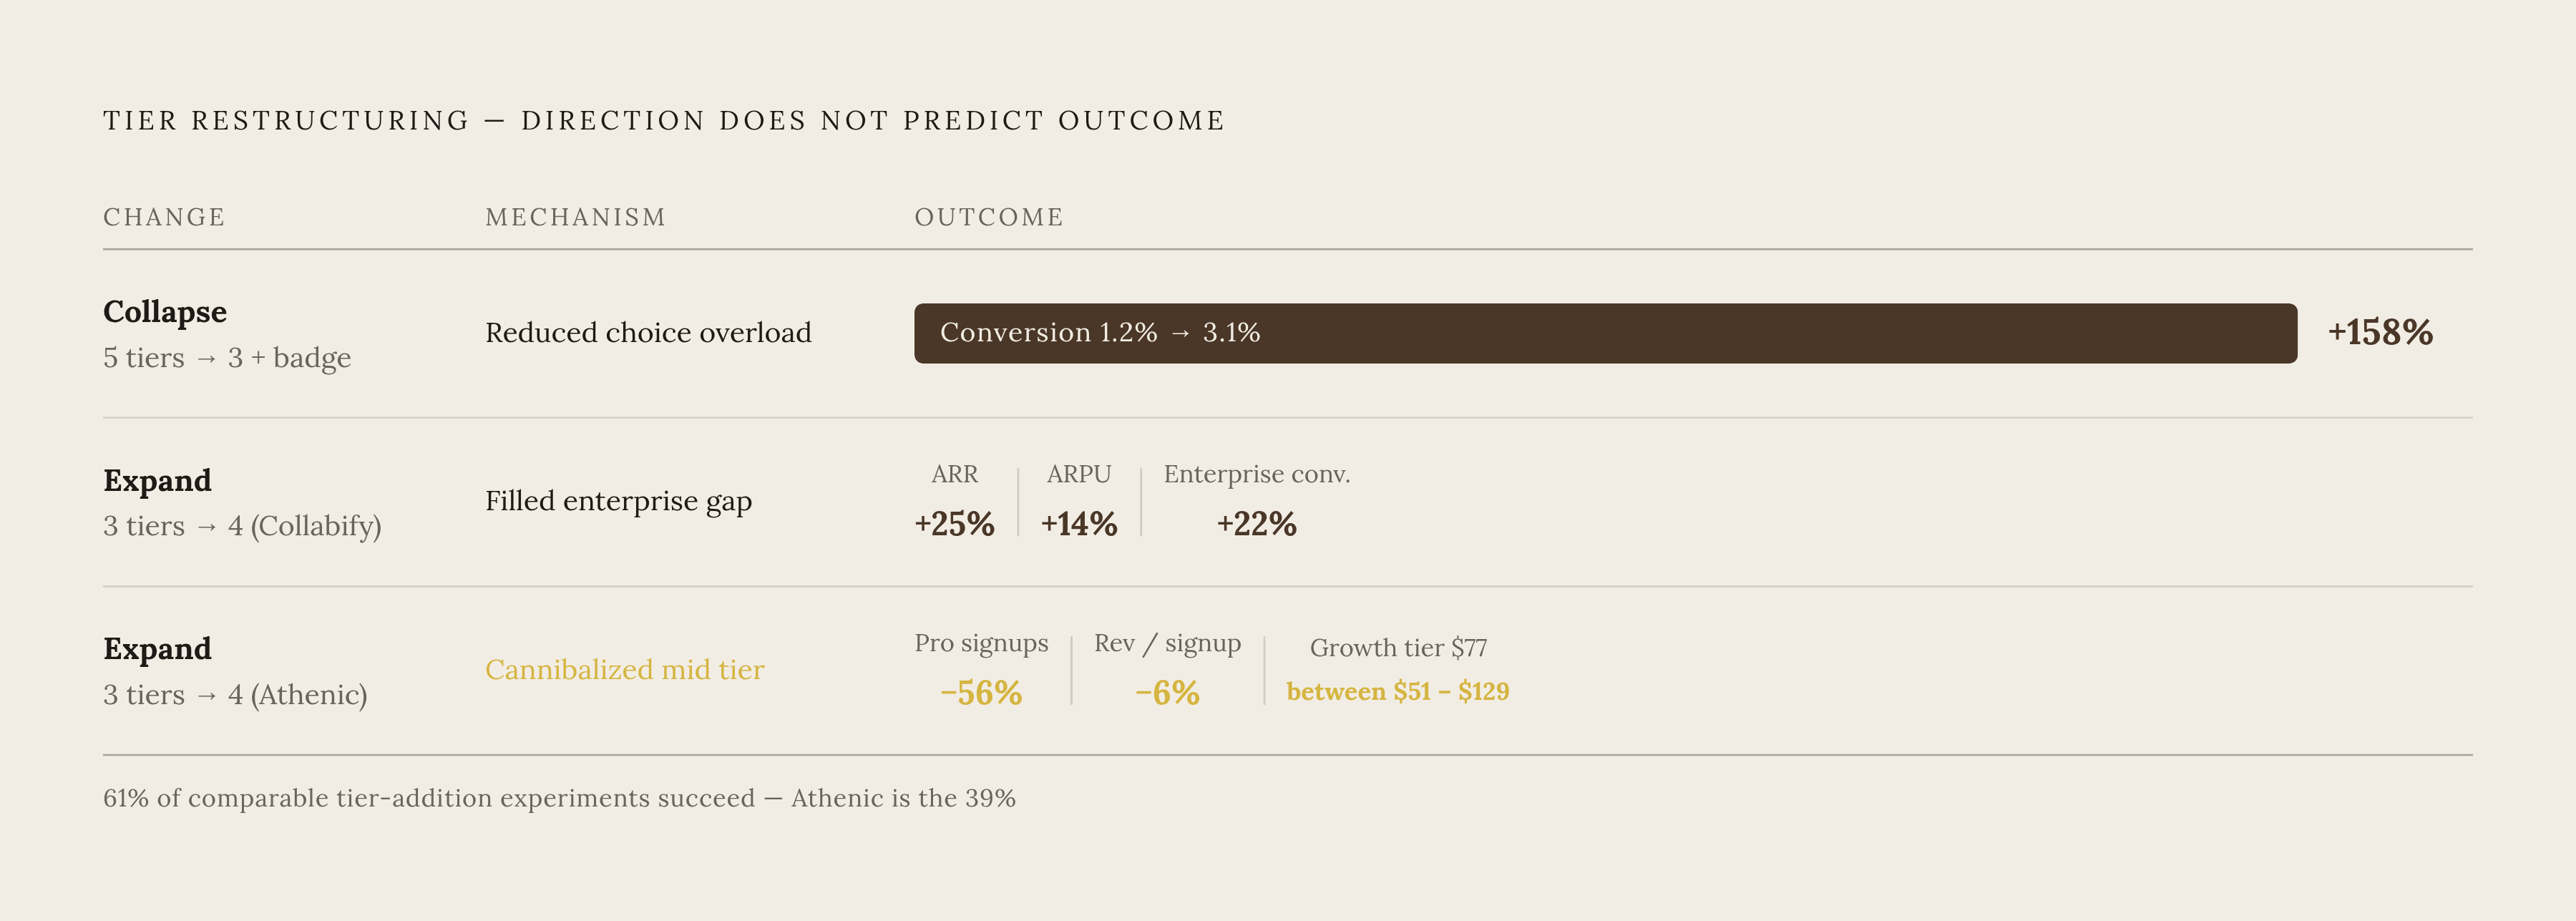
Collabify's May 2025 move to a four-tier structure, Starter at $8, Team at $19, Business at $39, Enterprise at $69, produced a 25% increase in ARR, a 14% rise in ARPU, and 22% more enterprise conversions. Each tier filled a real gap, and the price ladder was spaced evenly enough that buyers had a clear reason to step up at every rung.
Athenic tried something similar and got the opposite result. A new "Growth" tier at roughly $77 a month, between Starter (~$51) and Professional (~$129), caused Professional plan signups to fall by 56%, with average revenue per signup down 6%. The new tier wasn't filling a gap. It was sitting close enough to Professional that buyers took the cheaper near-substitute instead of stepping up, which is cannibalization by definition, dressed up as expansion.
Sixty-one percent of A/B tests that added a middle tier led to higher overall revenue, which sounds like a strong argument for expansion until you sit with the other number: a 39% failure rate is a real, recurring outcome. It's the Athenic pattern, repeating under a different name in nearly four out of ten attempts. Before adding a tier, the diagnostic question is whether there's an identifiable cohort of buyers converting to entry and churning, or not converting at all, because no existing tier fits their use case and budget. If that cohort exists, expansion is justified. If it doesn't, the new tier competes with the tiers already there for the same buyer, and somebody's ARPU pays for it.
Athenic's own data supplies the counterpoint. Adding a "Most Popular" badge to the Professional plan, no structural change at all, boosted Professional signups by 111% and lifted average revenue per signup by 41%. The positioning fix beat the structural one. The company that broke its own funnel by adding a tier fixed it with a label.
Repositioning experiments: feature boundaries, price jumps, and naming as conversion variables
A manufacturing SaaS company moved, in December 2025, from a three-tier per-seat model to a four-tier hybrid priced against workflows processed rather than headcount. ARR grew by $2 million, a 25% increase, average contract values rose 35%, and enterprise churn was cut in half. The tier count changed, but the real move was charging for the unit of value customers actually cared about, workflows, instead of a proxy, seats, that had stopped meaning much once AI features started doing work no human seat represented.
That's the highest-leverage repositioning move available to AI and usage-heavy products right now. A seat-based tier with AI bundled inside misrepresents the cost structure to the buyer and to the vendor both, because neither side is pricing the thing that's actually driving cost or value.
Framing changes count as repositioning too, even when nothing structural moves. Presenting the same annual price as "$0.23/day" instead of "$6.99/month" Hatem Ahmed's work at Posse Studio found a 34% conversion increase across 40 experiments run over 60 days using a Bayesian sequential testing framework. A mid-market SaaS company that clarified plan differentiation, simplified its feature comparison table, and gave more emphasis to annual billing saw a 68% increase in pricing page conversion and additional ARR over the following year, without touching a single price point.
Visual hierarchy is part of this too. Giving the highlighted plan real prominence on the page reduces the cognitive load a buyer has to carry, and that reduction raises conversion directly. Anchoring works the same way from the other direction: putting the highest-value plan first so the middle tier looks reasonable by comparison is a repositioning tactic layered on an unchanged structure, and the research behind these findings associates anchoring combined with decoy pricing with meaningful increases in average deal size. A growing share of SaaS pricing page traffic now happens on mobile, so any repositioning test that skips mobile is testing half a buyer experience and calling it whole.
Designing a tier restructuring experiment that produces usable results
Only 17% of companies test pricing on a regular basis, and the ones that do grow 25% faster than the ones running static pricing year over year. That gap comes down to methodology. It's a methodology gap, and it's closeable.
Hatem Ahmed's Bayesian sequential framework, from January 2026, cut average test duration from roughly eighteen days down to six. That matters more than it sounds like it should, because running two tier structures side by side for weeks creates its own risk: customer confusion, sales team confusion, support tickets asking why two people on the same call are seeing different prices.
A workable test needs a few things in place before it starts. Define the conversion event precisely, pricing-page-to-trial, trial-to-paid, and paid-entry-to-mid-tier-upgrade are three different experiments, not one. Isolate a single variable, tier count, feature boundary, price point, naming, or visual hierarchy, rather than changing several at once and hoping to sort out later which one moved the number. Set a stopping rule before the test starts, or use a sequential method, so nobody reads the results early just because they happen to favor the hypothesis that day. And track downstream effects, not just the target metric: where did drop-off go, not only whether it shrank.
Legacy customers need protection built into the test itself, not bolted on afterward. Pricing changes that don't grandfather existing customers reliably trigger churn spikes, and migration design belongs in the experiment plan from day one, not in a follow-up meeting after churn appears.
One of the lowest-risk, highest-frequency levers doesn't require touching tier structure at all: setting the billing toggle to "Annual" by default shifts a meaningful share of buyers into annual plans and raises ARR per customer, with none of the structural risk that comes with adding or cutting a tier. And none of this produces a diagnosis without instrumentation in place beforehand, specifically real-time visibility into which tier buyers land on, where they exit the page, and how their usage tracks against the limits of the tier they picked. Without that, an experiment produces a number. It doesn't tell you why the number moved.
Reading the results: metrics that distinguish a tier fix from a pricing page fix
Self-serve SaaS pricing pages typically convert somewhere between 2 and 5%, and pages with real tier clarity and a well-placed middle plan can push toward the top of that range. Knowing the baseline before running a test isn't optional homework, it's the only way to know afterward whether anything actually moved.
ARPU is the cleanest signal for whether a restructuring did what it was supposed to. Athenic's badge experiment, the one that lifted Professional signups 111%, also drove a 41% increase in average revenue per signup. That's a positioning result, not a volume result, and the distinction matters for what happens next.
Conversion rate and ARPU can move in opposite directions and both readings can be correct. Add a tier that pulls buyers down from a pricier plan, and conversion rises while ARPU falls, which is exactly the shape of Athenic's Growth tier failure. On a conversion-only dashboard, that failure looks like a win. Retention adds another layer: annual customers churn less and carry more value per account, so an experiment that boosts short-term conversion at the expense of the annual mix isn't a clean win, it's a tradeoff that needs to be named as one.
Athenic's badge-only surge, 111% with no structural change at all, is worth reading as a diagnosis in itself: when a social-proof signal alone produces that kind of lift, the prior tier structure wasn't confusing anyone about value. It was causing paralysis. The fix was anchoring, and mistaking it for restructuring wastes an engineering cycle.
Athenic's billing-cycle framing test, run between April 2024 and October 2025, offered "2 months free" against "20% off" and found annual signups rose 342%, lifetime value climbed 62%, and churn fell from 6.2% to 2.8%. That's a payment-mechanics result wearing a tier-experiment costume. The general rule for all of these: figure out whether conversion improved because buyers found the tier that actually fit them, or because friction dropped off the page. The first calls for a structural fix. The second calls for a design and copy fix, and confusing the two means solving the wrong problem next quarter.
The billing infrastructure a tier restructuring experiment requires
None of this works at any real speed without billing infrastructure that can model new pricing logic, meter usage against tier limits, and generate accurate invoices without an engineering ticket for every change. That's the practical constraint shaping the whole discussion.
If moving a feature boundary or adjusting a usage limit requires filing a ticket and waiting on an engineering sprint, pricing experimentation runs on a multi-week cycle no matter how good the statistical method is. The Bayesian framework that cut test duration to six days doesn't matter if the underlying billing change takes three weeks to ship. Usage-based and hybrid tiers raise the stakes further, since metering has to track consumption accurately in real time, or the entire test is measuring a broken meter instead of buyer behavior. Getting tier restructuring right is also an infrastructure question. It's an infrastructure question wearing a pricing question's clothes, and companies that treat it as the former tend to find out the hard way which one it actually was.
Sources
- SaaS Pricing Strategy and Models 2026: From Value-Based to Usage-Based Pricing | Zylos Research
- 30 SaaS Pricing Experiments: Real Results on Tiers, Billing & Discounts
- 2026 SaaS Management Index
- 2026 SaaS Procurement Trends | Tropic
- The SaaS Pricing Strategy Guide for 2026: Why Usage-Based is Winning (And When to Use Tiered, Per-User, or Value-Based Instead) - Momentum Nexus Blog
- digitalapplied.com
- 2026 SaaS Procurement Trends | Tropic
- digitalapplied.com